Network Profiler in Android Studio 3.1
Ported from Medium, original source here
Android Studio 3.1 recently came out of beta. It has a lot of features such as kotlin lint checks, D8 compiler and also a revamped Network Profiler.
From early days of DDMS, we could always check how network data was being consumed but the current iteration of profiler has added a whole new set of features. Let’s check them out
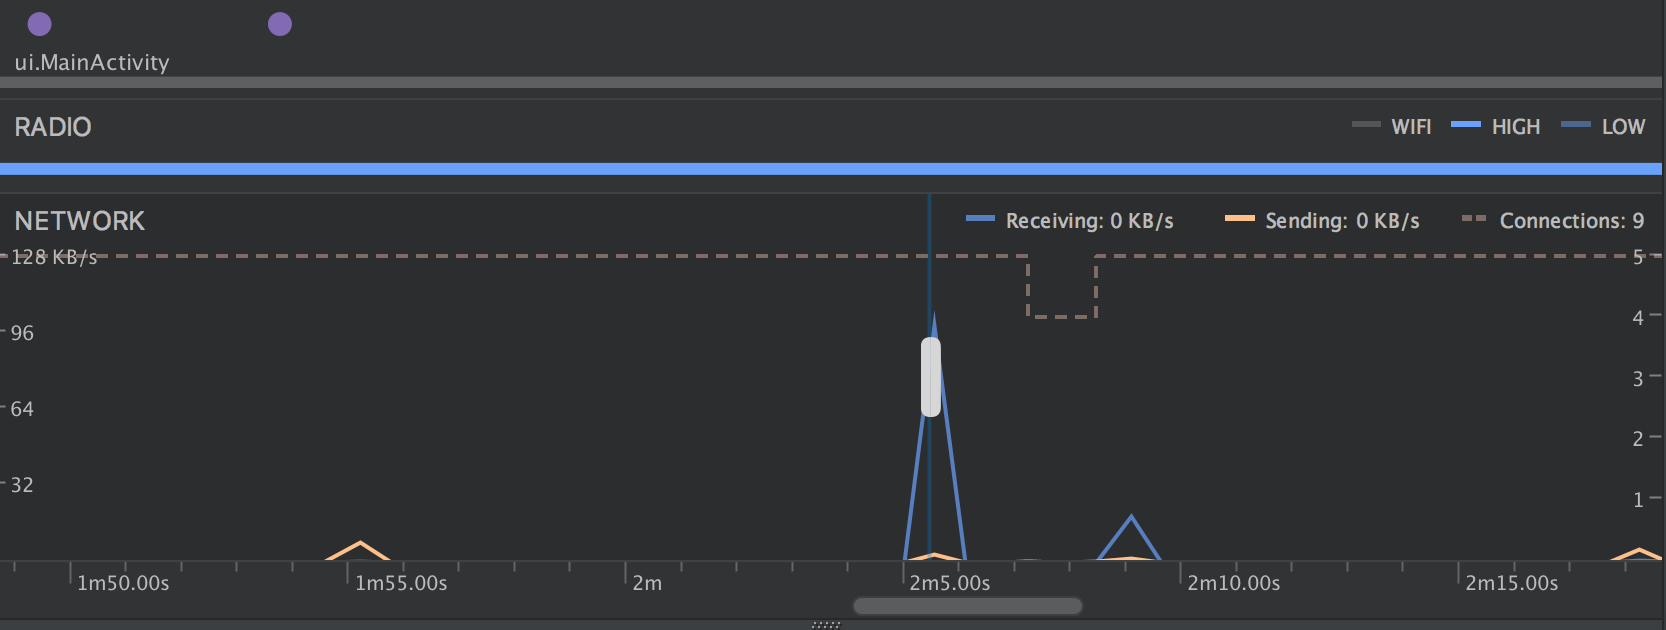
First of all, network graph looks pretty neat
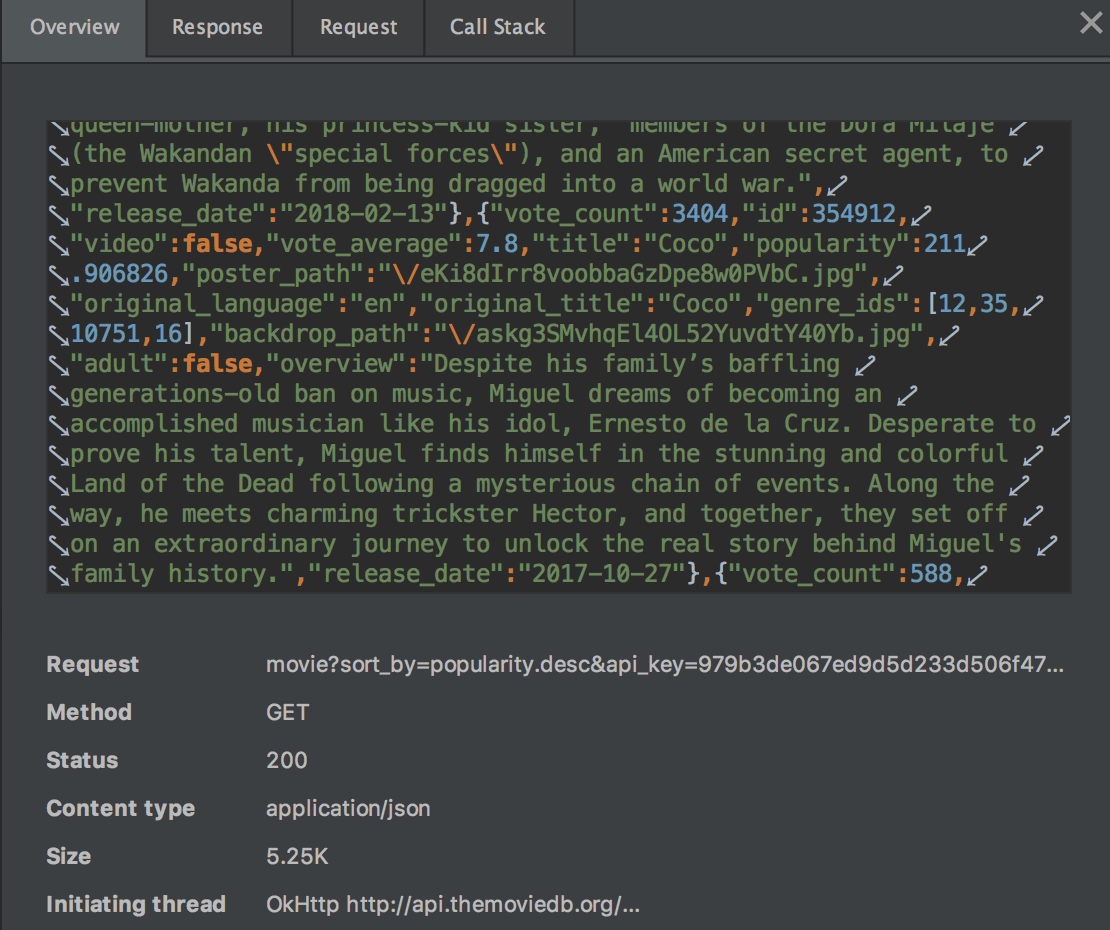
Request Debugging
Clicking on any request in graph will give you it’s details such as Request type and Response data.
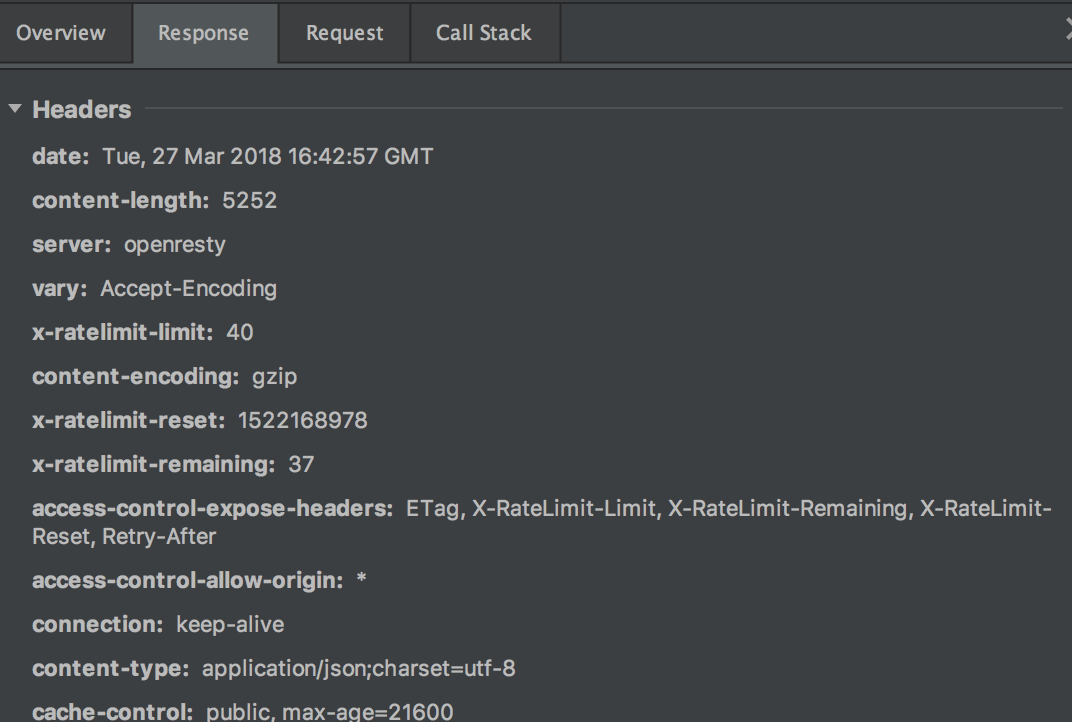
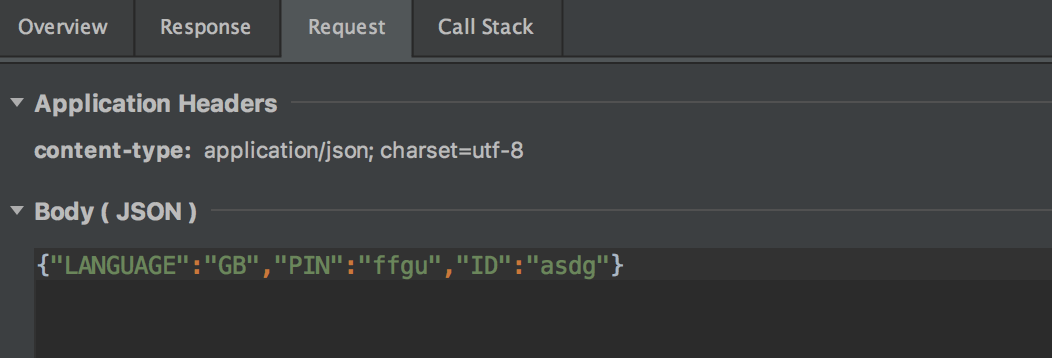
You can also check Request and Response headers
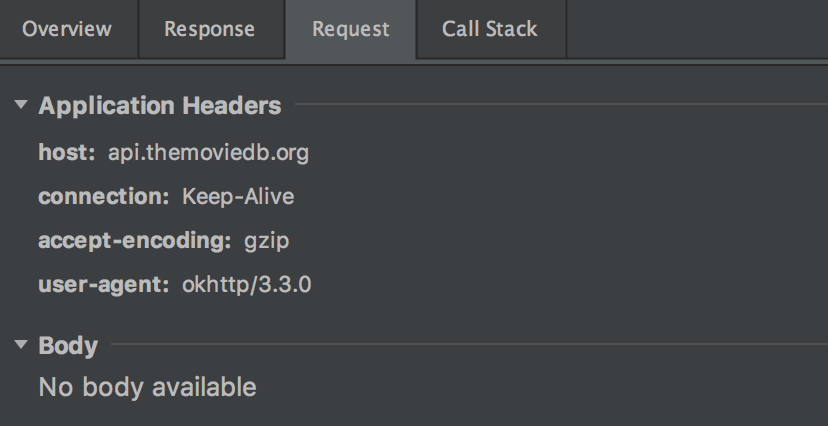
If it’s a POST request, you can see body of request as well
I have found this to be very useful. In past I have used tools such as Charles to intercept and find request/response related details especially when dealing with third party APIs. This allows us to completely avoid that and check such details directly from Android Studio!
Bonus Point — If you are using third party SDKs, you can always check any arbitrary request going from your app and get details such as server url etc. Below is an example request sent from Crashlytics caught by the profiler
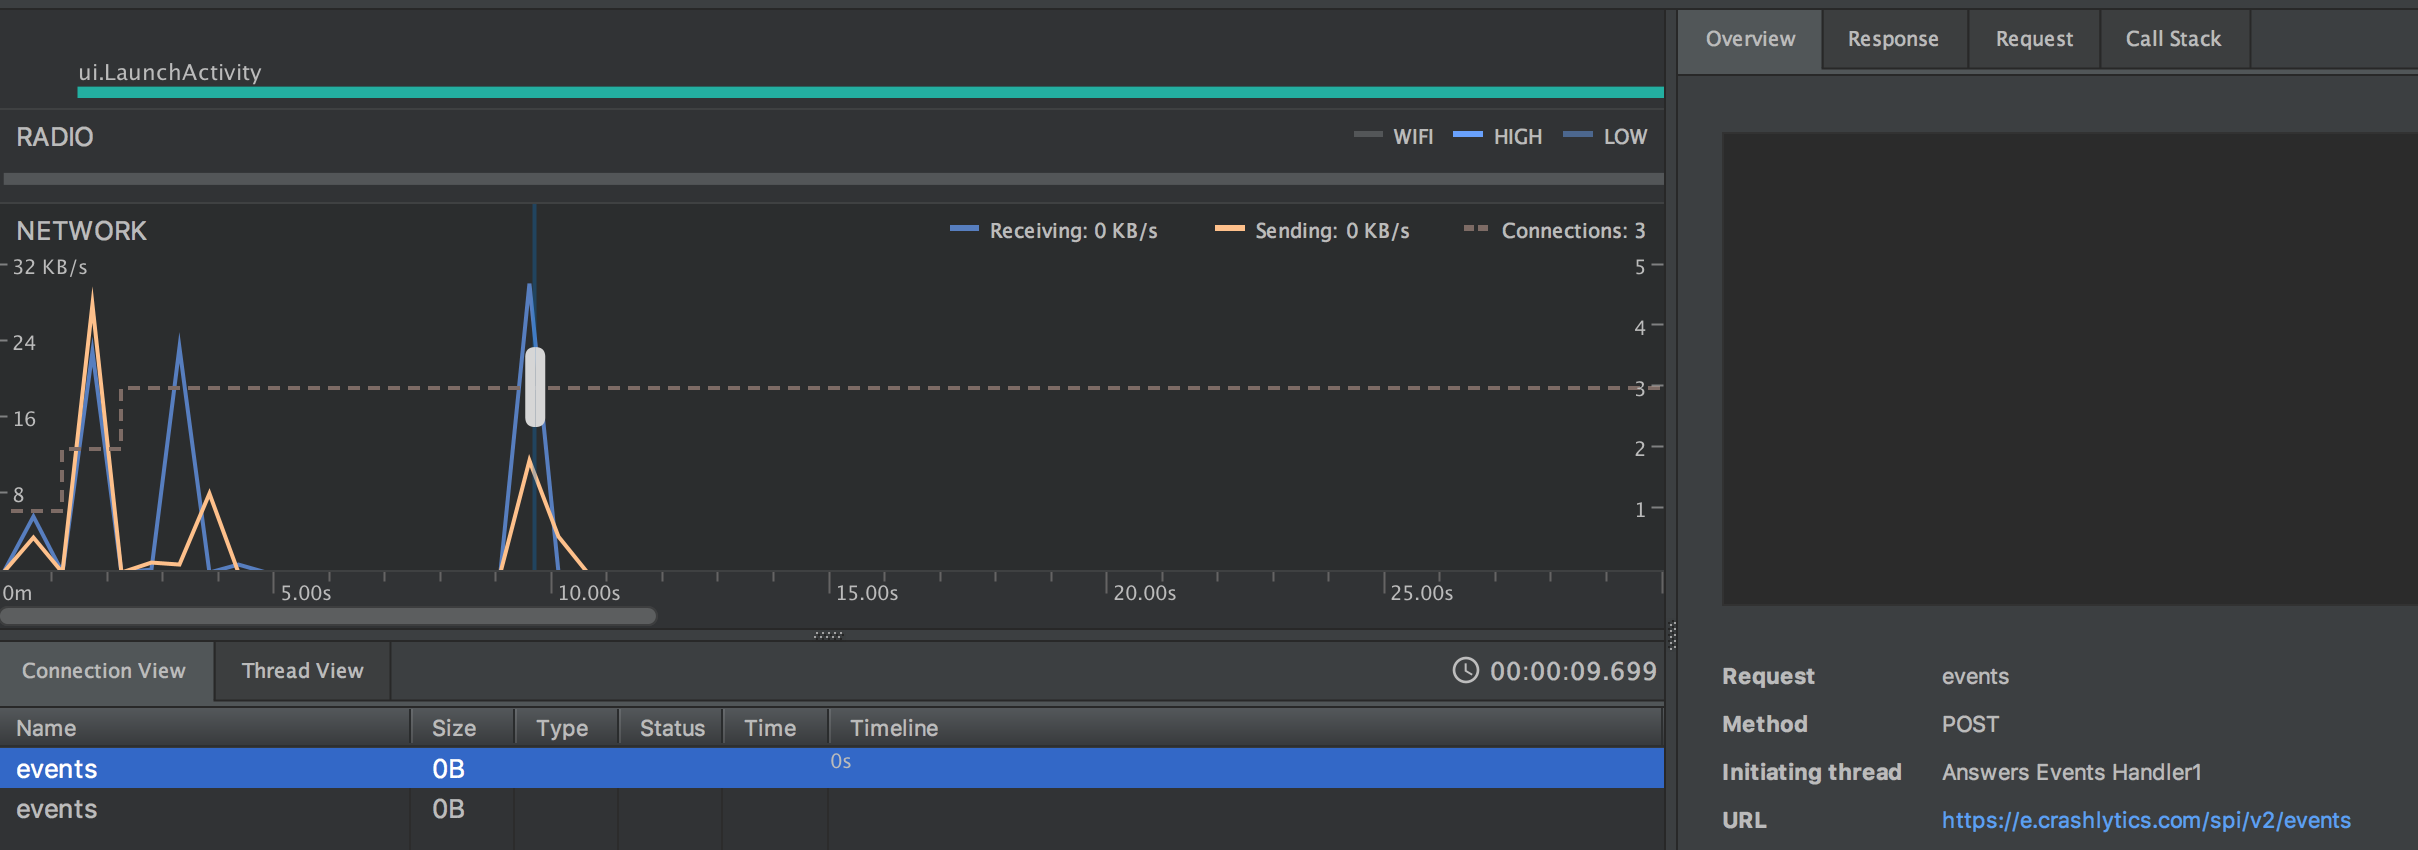
Always better know such things in advance, than getting red faced later.
And one last thing
Profiler can also help you catch radio bursts of high power when you’re on mobile network.
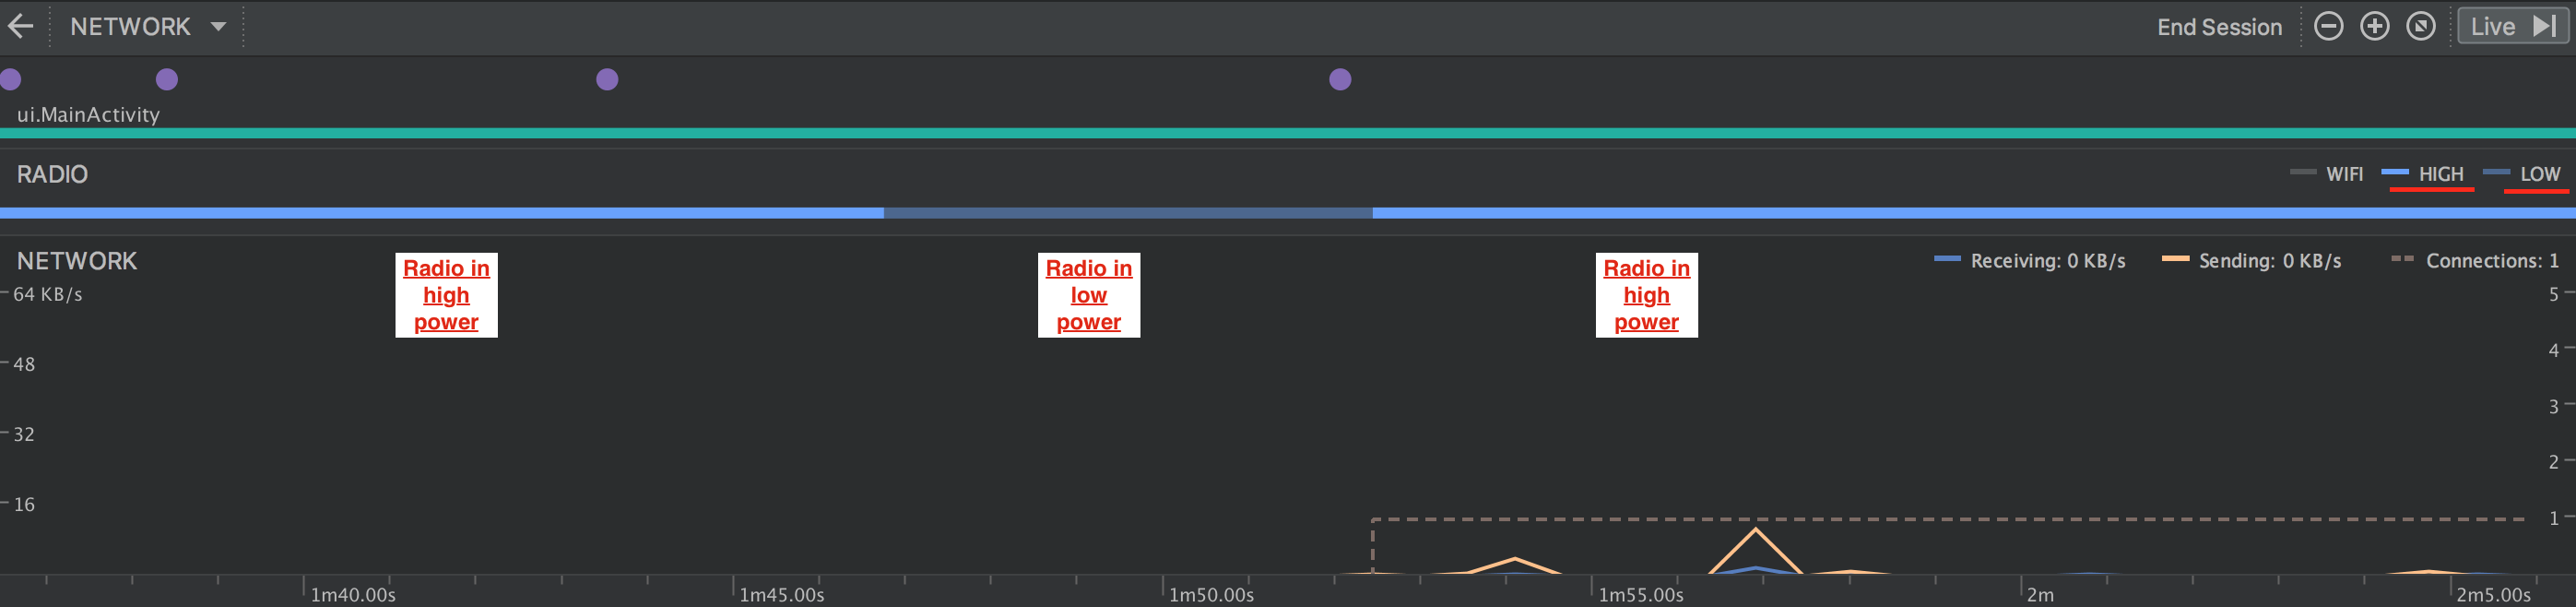
The graph presents a timeline of when your application causes the radio to remain in high power mode which in turn causes more battery consumption. You can use this to investigate network calls and make your application more battery friendly.
To understand more about Radio state machine, read here
That’s all. Thanks for reading!